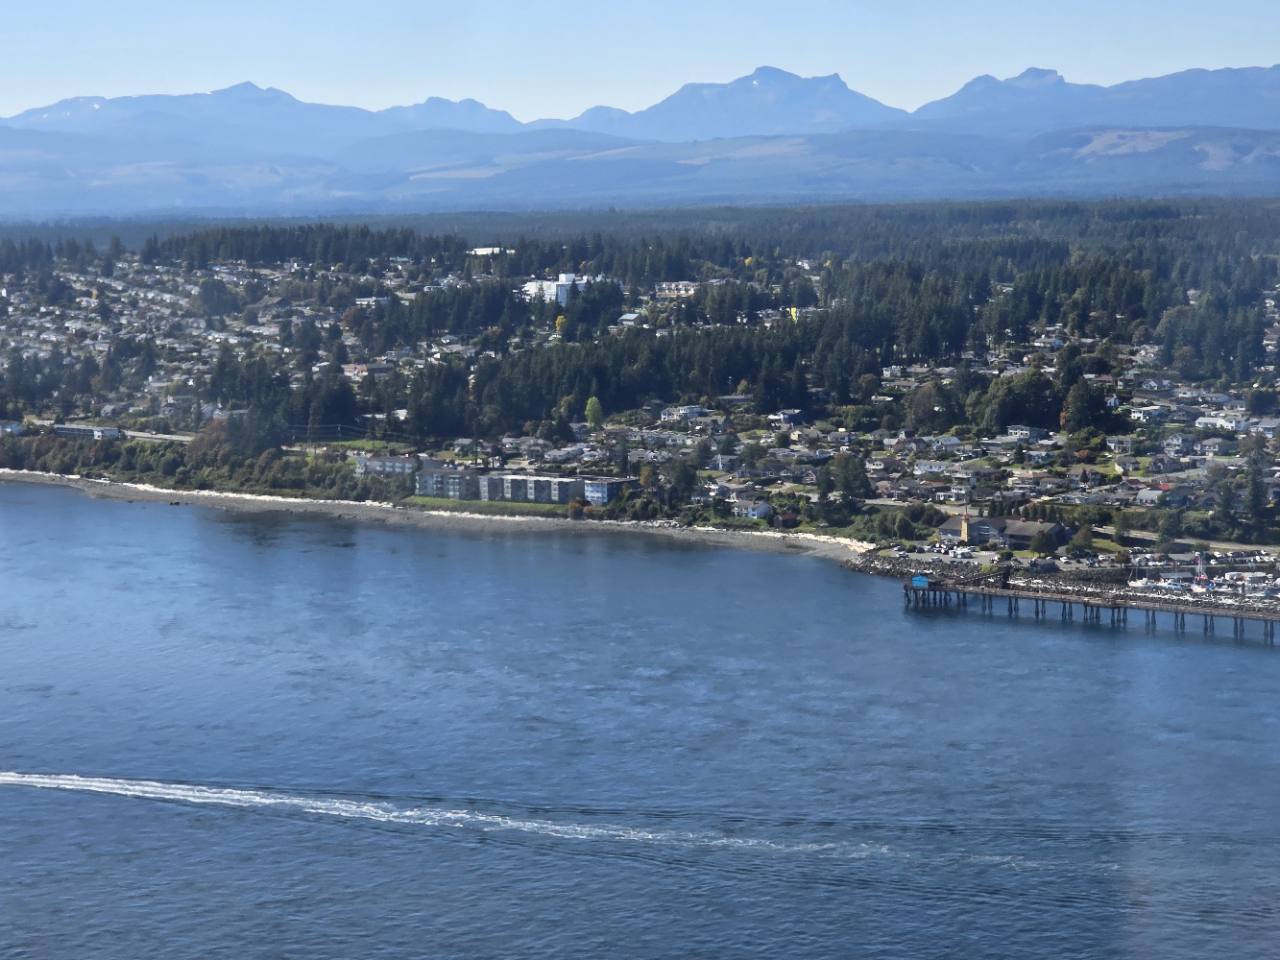
In some ways, the numbers are council's report card. The election is also council's report card.
01 / The Record
Downtown safety.
Streets, parks, the library and downtown businesses must be usable by everyone.
I work downtown. I know the difference between a better statistic and a morning when staff arrive to broken glass. Both matter. People need treatment, recovery and somewhere stable to live, and the public needs safe places to go about daily life.
Downtown calls for service fell 20.5%, comparing January through November 2025 with the same period in 2024. The separate chart below shows full-year citywide calls.
The City labelled this measure annual file count from 2015 through 2021 and calls for service from 2022 onward. Later annual reports restated the 2018 and 2019 totals; this chart uses the later figures. The vertical line marks the October 2022 election, and each point is a full calendar year.
The chart starts in 2015, where verified annual totals are uninterrupted. Earlier observations are retained in the source archive; 2012-2014 totals could not be verified from the available chart images.
What should be measured next: Publish a small safety dashboard that separates calls, chargeable offences, repeat locations, downtown conditions and resident confidence.
Homes with support
Homewood grew to 48 spaces.
Eight spaces were added in 2025. The temporary housing program combines a place to live with support services, through the City, BC Housing and operator Lookout.
Capacity is one measure. Stable housing outcomes and access to services matter too.
The annual report records capacity for 48 residents, including eight spaces added during 2025. These spaces are not added to the permit or HAF totals.
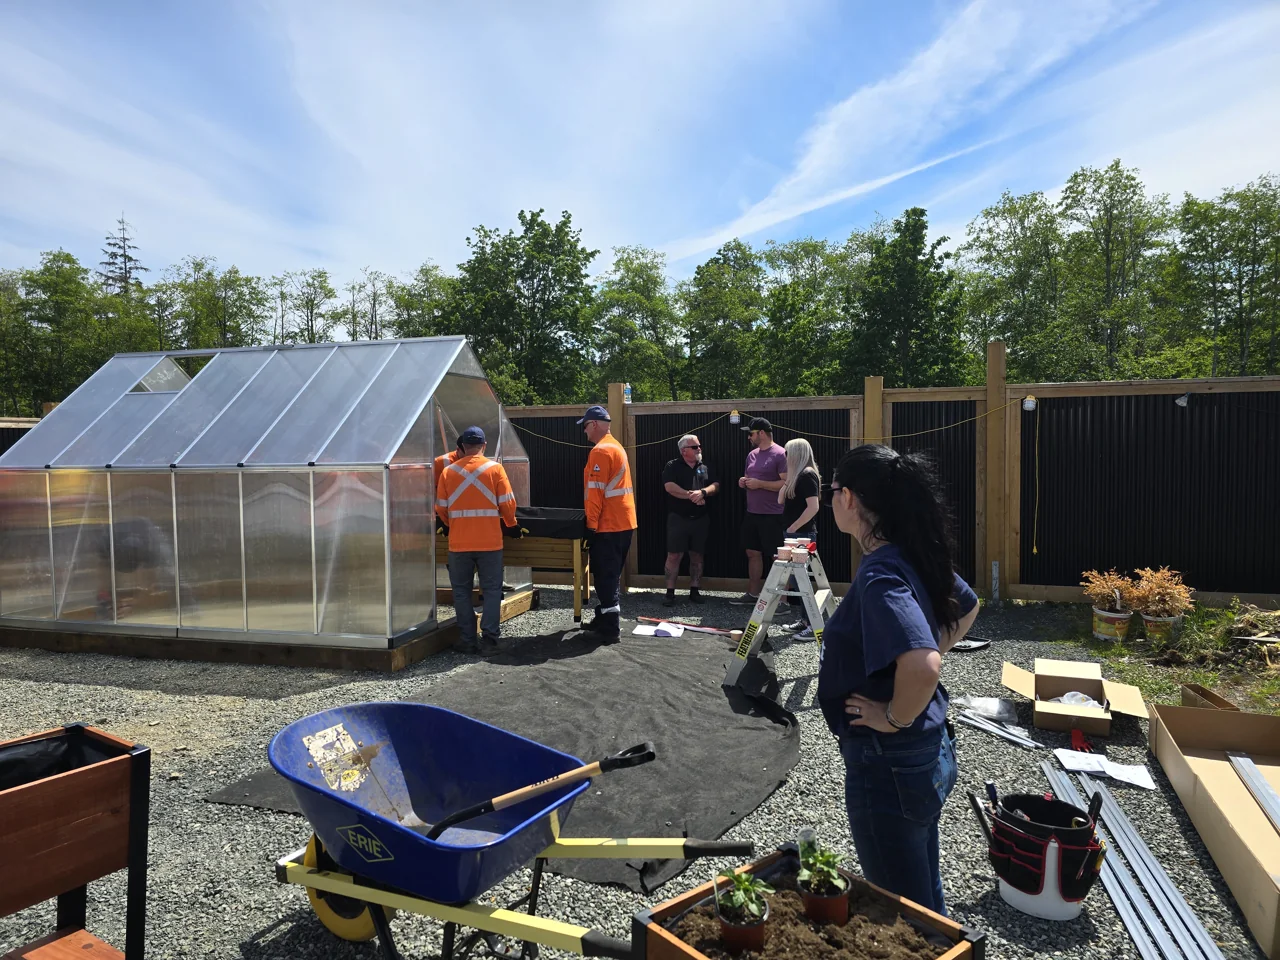
A visit to Homewood Village, May 2026. Photo: Ben Lanyon.
Capacity has to reach the street.
The 2026 plan funds 44 RCMP positions within an authorized ceiling of 55, alongside eight budgeted front-line bylaw positions. Funding and authorization do not tell us how many officers are available for duty.
Police staffing and the broader crime recordExpanded
Police and bylaw positions
From 2018 to 2026, RCMP authorized strength rose from 43 to 55 and budgeted front-line bylaw positions rose from 3 to 8. The 2026 RCMP funded complement is 44, not 55.
2018-2026 / authorized and budgeted positions · Positions
RCMP regular members
Authorized is the recruitment ceiling. Funded is the City budget.
552026 · RCMP authorized
RCMP authorized55
RCMP funded44
Bylaw enforcement
Budgeted front-line officers; manager and contracted security excluded.
82026 · Bylaw officers
Available-for-duty strength is not reported in this series.
Sources & methods
Authorized, funded and available-for-duty are different measures. Vacancies, leave, training and RCMP deployment affect actual police presence; the 2026 bylaw complement includes temporary operating-project positions.
The 2018 plan approved a staged increase from 43 authorized members: one position took effect in 2019 and the second in 2021. That 45-member ceiling stayed in place until the four-member increase approved for 2024; Council raised it to 55 in April 2026 as a recruitment buffer without increasing the funded complement of 44.
The bylaw series counts front-line Bylaw Enforcement Officer positions, not the Bylaw Services Manager, clerical staff, animal control or contracted security. The fourth officer was added in 2023, two more in 2024, and the adopted 2026 operating project continued those two positions while funding two additional officers.
The 2025 Annual Report states that the City funded 46 RCMP members. The April 2026 resourcing decision describes 44 as the existing funded complement. The chart reports each official publication's stated figure and does not infer why the published count changed.
Where an annual report did not restate RCMP authorized strength, the last Council-approved ceiling is carried forward. Funded values use the corresponding annual financial plan or annual report.
What should be measured next: Publish authorized, funded and available-for-duty RCMP numbers beside budgeted and filled bylaw positions in one annual public dashboard.
Public safety
Crime severity came down. It is still too high.
Overall crime severity fell 23.7% from the 2023 peak to 2025, but remained above the B.C. level. The improvement matters. So does the work still ahead.
140.132025 · Campbell River municipal RCMP
Campbell River municipal RCMP140.13
British Columbia92.37
Compared with 2022, overall crime severity was 10.4% lower in 2025, while violent crime severity was 2.5% higher. The index measures the volume and seriousness of police-reported crime. It is affected by reporting, policing practices and other factors, so it does not prove that Council caused every change.
Sources & methods
Statistics Canada, Table 35-10-0063-01, Campbell River municipal RCMP and British Columbia.
The 2022 baseline largely predates this Council. Campbell River municipal RCMP: overall CSI 156.42 in 2022 and 140.13 in 2025; violent CSI 158.97 and 163.02; non-violent CSI 156.72 and 132.17. Each percentage change is (2025 value ÷ 2022 value − 1) × 100. These are separate indices, not counts of offences.
Lower than nearby does not mean affordable. The household budget is the test.
Families need room to get started. Seniors need room to stay. Council does not set market prices, but zoning, permits, fees and infrastructure shape what can be built and at what cost.
Rent rose more slowly here
Average rent was $1,556 a month in October 2025, below Courtenay at $1,622 and Nanaimo at $1,688. Campbell River's average had risen by $254 since 2022.
October surveys, 2021 to 2025 · Average monthly rent ($)
$1,5562025 · Campbell River
Campbell River$1,556
Courtenay$1,622
Nanaimo$1,688
Purpose-built rental survey averages, not current asking rents or the increase on every tenant's lease.
Sources & methods
Average rent reflects the surveyed purpose-built stock and its mix. It is not an asking-rent measure for every available unit.
All lines are CMHC October averages for purpose-built rental apartments, using the total unit mix.
Year
Campbell River
Courtenay
Nanaimo
2021
$1,269
$1,201
$1,200
2022
$1,302
$1,308
$1,355
2023
$1,464
$1,384
$1,465
2024
$1,428
$1,596
$1,556
2025
$1,556
$1,622
$1,688
What should be measured next: Watch turnover rents, vacancy, new rental completions and household income together before declaring the market healthy.
The monthly household test
Rent rose faster than everyday prices.
Campbell River's average rent rose $254 a month between 2022 and 2025. Even after allowing for inflation, the increase was 9.7%.
Campbell River average rent+19.5%
B.C. consumer prices+8.9%
2022 to 2025. Survey averages include changes in the mix of rental homes. This is not the increase on every tenant's lease or a measure of asking rents.
October survey averages: $1,302 in 2022 and $1,556 in 2025. Annual B.C. CPI: 145.5 and 158.5. The 2025 rent equals about $1,428 in 2022 purchasing power. Real change = (1,556 ÷ 1,302) ÷ (158.5 ÷ 145.5) − 1. Bars share a zero-to-25% scale. This calculation compares survey averages; it is not CMHC's same-sample rent-growth measure.
Buying a home: prices by market and typeExpanded
Single-family prices below nearby markets
In August 2026, Campbell River's single-family benchmark was $155,400 below Comox Valley and $130,100 below Nanaimo. A lower price does not tell us whether local incomes can afford it.
August snapshots, 2021 to 2026 · Benchmark price ($)
$690,0002026 · Campbell River
Campbell River$690,000
Comox Valley$845,400
Nanaimo$820,100
August single-family benchmarks from one revised report. Lines connect published observations, not every intervening year.
Sources & methods
A benchmark is not the price paid by every buyer, and local government cannot claim that it caused regional market movement.
Every point is an August single-family benchmark from page 6 of VIREB's August 2026 package. Its historical figures are revised onto the same basis. The report provides 2021, 2023, 2025 and 2026 endpoints; connecting lines do not supply missing annual observations.
Earlier reports contain different historical values. A September 2022 snapshot from an older edition cannot establish a like-for-like change to August 2026. Inflation-adjusted home-price claims are omitted until a matching August CPI observation is verified.
What should be measured next: Track approval time, completed homes, product type and price relative to local incomes, not just headline market values.
The type of home matters
Prices moved differently for different homes.
From August 2023 to August 2026, single-family prices rose, apartment prices fell and townhouse prices barely moved. Looking only at single-family homes misses that difference.
Campbell River · August 2023 to August 2026
Single-family
+4.4%
2023
$661,200
2026
$690,000
Apartment
-5.6%
2023
$368,400
2026
$347,800
Townhouse
+0.6%
2023
$543,200
2026
$546,600
A benchmark estimates the price of a typical home. These figures are not adjusted for inflation. Every comparison uses the revised history in the same August 2026 report.
Change = (2026 benchmark ÷ 2023 benchmark − 1) × 100. All bars share a zero-to-$700,000 scale. VIREB revises earlier benchmarks, so comparing figures copied from different editions can give the wrong change. These are price indices for typical properties, not average sale prices or evidence of Council's effect on prices.
More rentals available. Still tight.
About two of every 100 surveyed rental homes were vacant in October 2025. That is more choice than in 2022, when the rate was 1.5%, but still a small pool of available homes.
October surveys, 2021 to 2025 · Rental vacancy rate (%)
2%2025 · Campbell River
Campbell River2%
Courtenay3.1%
Nanaimo2.2%
CMHC primary rental market survey, October observations.
Sources & methods
These are CMHC reporting-centre estimates, not municipal-boundary counts. Survey reliability varies by observation, and vacancy alone does not describe rent, suitability or availability by unit type.
All lines are CMHC October vacancy rates for the total purpose-built rental apartment market.
Year
Campbell River
Courtenay
Nanaimo
2021
1.2%
0.3%
1.8%
2022
1.5%
0.6%
2.2%
2023
0.9%
0.9%
2.6%
2024
1.8%
4.3%
2.9%
2025
2%
3.1%
2.2%
Method notes
Courtenay is used as the Comox Valley reporting-centre comparison.
The series uses the total primary-rental vacancy rate reported in CMHC's annual October survey.
What should be measured next: Measure whether new rental supply moves vacancy toward a durable range without losing lower-rent units through turnover or redevelopment.
From permission to places to live
More homes permitted. More still needed.
The City permitted 351 homes in 2025, up 36.6% from 2022. Of those, 270 were multi-family units, about 77% of the total.
The housing-needs assessment models 2,842 homes over five years, or about 568 a year. The bars show permits issued each year, so they measure permission to build rather than finished homes.
New residential units permitted · City boundaries · 2021 to 2025
Planning benchmark: 568 homes a year
516
2021
257
2022
283
2023
249
2024
351
2025
A permit allows construction. It does not mean a home is finished or occupied. The dotted line is the City's modelled annual housing need for 2021 to 2026, not a construction forecast.
The annual register counts units, not applications. Its 2025 total is 351; the annual report says 349. This chart consistently uses the permit registers. The City rounds its five-year model to 568 homes annually. Need includes existing pressures and growth; it is not a shortage created entirely during this Council's term.
Housing Accelerator Fund: progress and fundingExpanded
Housing Accelerator Fund
Rules changed, but permits fell behind the plan.
CMHC's second annual review recorded 571 permitted homes against 786 expected by that stage. Six of seven planned policy changes were complete. Changing the rules is useful, but people still need the homes to be built.
CMHC review · February 23, 2026
571homes permitted of 786 expected by this review
215 below the interim forecast · 73% of the expected progress
Full three-year permit target
1,277 45% reached at this review
Federal funding received
$7,815,744 of $10,420,992 approved
Reform initiatives complete
6 of 7 Land strategy still in progress
Program reporting periods differ from calendar-year permit totals. Funding received is not the same as money spent, and permits are not completed homes.
The 1,277 target includes a 995-home baseline plus 282 additional homes expected through HAF. Three advances of $2,605,248.08 total $7,815,744.24, against $10,420,992.30 approved. This is a receipt calculation, not a spending audit. The affordable-housing category reports 0 against a 209 target; that does not mean no affordable homes exist or were built citywide.
The useful next test is completed and occupied homes, their rents and prices, and a reconciliation of HAF spending to results.
Then there is the City's part of the bill.
Every dollar City Hall receives came from somebody. Keeping increases down matters, alongside reliable services and infrastructure.
#1 for the lowest municipal tax increase
2022 to 2026 · Compounded municipal increases#1
Lowest municipal tax increase in B.C.
Among all 12 municipalities with 25,000 to 50,000 residents · B.C. Stats, July 2025Five annual increases: the previous Council's 2022 budget and this Council's four budgets from 2023 to 2026.
20223.13%20239.97%20243.47%20252.89%20262.70%
0%65%
Municipal percentage increases, not the complete household tax bill.
Sources & methods
This compares percentage increases, not total tax bills, service levels, assessment changes, utilities or household circumstances.
Campbell River ranked #1 for the lowest compounded municipal tax increase from 2022 through 2026 among all 12 B.C. municipalities with 25,000 to 50,000 residents, using B.C. Stats' July 1, 2025 estimates.
The same population band, all 12 municipalities.
The table includes all 12 B.C. municipalities with 25,000 to 50,000 residents in B.C. Stats' July 1, 2025 population estimates. This follows the population band used in the City's tax review. It is a campaign calculation, not a City ranking. The complete-bill comparison uses a separate, fixed 11-community cohort.
Five annual increases are included: the previous council's 2022 budget and this council's 2023 through 2026 budgets. The 2022 increase is already part of the starting bill in the separate household-bill comparison.
Municipal reporting methods differ. Squamish's 2026 figure measures revenue-requirement growth including tax-base growth; its earlier figures measure existing-taxpayer or average impacts. Courtenay's 2022 figure comes from a staff recommendation; final adoption has not been independently confirmed. Rates and sources are listed above so the calculation can be checked.
Totals are calculated from the annual figures shown, then rounded to two decimal places. Small differences from comparisons using previously rounded multi-year totals can result.
The chart's B.C. and Canada toggles use Statistics Canada's property taxes and other special charges index. From October 2021 to October 2025, the index increased 37.3% in B.C. and 21.6% in Canada. Statistics Canada follows a constant sample of owner-occupied homes and includes assessment changes, municipal and provincial rates, special service charges and homeowner rebates. These hollow bars provide household context; they are not a like-for-like average of Council-approved 2022-2026 budget increases.
Index values: Canada 172.8 to 210.2; British Columbia 210.1 to 288.5. Cumulative change = ending index / starting index - 1.
*B.C. and Canada use Statistics Canada's homeowner property-tax index for October 2021 to October 2025, the latest complete period. It tracks taxes and special charges on a constant sample of homes, including assessment changes, service charges and rebates. It is context, not the same measure as a Council-approved budget increase.
Method notes
All 12 B.C. municipalities with 25,000 to 50,000 residents in B.C. Stats' July 1, 2025 estimates. No out-of-band additions. This is a campaign calculation, not a City ranking.
Includes five annual increases: the previous council's 2022 budget and this council's 2023 through 2026 budgets. Squamish's 2026 value includes tax-base growth; earlier years use taxpayer or average impacts. Municipal reporting methods differ.
Blue identifies Campbell River; grey identifies the peer municipalities.
Annual figures are published municipal increases, which are nominal annual percentages. Because increases compound, the five annual percentages multiply rather than add, so each segment is drawn to that year's share of the compounded total.
What should be measured next: Keep this population-based peer method explicit. The separate 11-community complete-bill comparison uses a different, fixed cohort.
Complete tax bill: fourth-lowest
At $6,085, Campbell River's representative-home bill ranked fourth-lowest in this 11-community comparison. The blue portion is municipal taxes and charges; the rest is collected for other public bodies.
2026 / Representative house / Before the Home Owner Grant · Total taxes and charges ($)
Municipal + charges
Regional + hospital
School + agencies
Langford$5,295
Vernon$5,774
North Cowichan$5,783
Campbell RiverOur community$6,085
Municipal + charges
$4,048
Regional + hospital
$931
School + agencies
$1,106
Courtenay$6,115
Penticton$6,190
Mission$6,732
City of Langley$7,240
West Kelowna$7,356
Port Moody$9,819
West Vancouver$14,403
Bars start at zero. Exact values shown for every community.
A different comparison: fixed group of 11 communities using 2021 Census populations. Any future values are illustrations, not forecasts.
Sources & methods
Each community's representative house has a different assessed value and service mix. This compares published bills, not identical homes or tax rates. This fixed 11-community group differs from the 12-community tax-increase ranking.
The City's formal comparator method includes every B.C. municipality with a 2021 Census population from 25,000 to 50,000.
The current Council was elected in October 2022. The marker provides political context; it does not assign every later change to Council.
Municipal + charges combines General Municipal, residential parcel taxes and residential user fees. Regional + hospital combines those two levies. School + agencies combines School with BCA, MFA and Other.
The light-blue stack uses each municipality's total property-tax requirement, not a claimed tax-rate increase for an individual existing property.
The illustrated 2030 total is calculated as: 2026 complete bill minus 2026 General Municipal tax, plus 2026 General Municipal tax multiplied by the municipality's 2030-to-2026 property-tax-requirement ratio.
The expandable table shows the official 2026 endpoint. Separate downloadable CSV files preserve all 77 historical records and all 11 plan-projection inputs.
West Vancouver's much higher representative assessment lifts the arithmetic average; the median is the more stable middle-of-group benchmark.
What should be measured next: Replace the illustration with each new Schedule 704 actual, and update adopted-plan values whenever a council amends its financial plan.
Reserves, debt and the full budgetExpanded
Reserves up. Debt down.
From 2022 to 2025, audited reserves increased by $12.4 million, or 19.4%, while long-term debt fell by $2.7 million, or 27.5%.
2010-2025 / millions of dollars · Millions of dollars
$76.7m2025 · Reserves
Reserves$76.7m
Long-term debt$7.1m
Closing balances do not show whether reserves were drawn down during the year.
Sources & methods
These totals do not show which reserves are restricted, when projects need the money or whether returns will keep up with construction costs.
Reserves combine statutory and non-statutory reserves and exclude unappropriated operating surplus.
The audited statements use narrower revenue categories. This page uses tax in the broad accountability sense: money required from the public or transferred from another government's taxpayers.
The City's reserve policy says reserves should stabilize tax levies, handle emergencies, finance new assets, safeguard existing assets and balance costs between current and future taxpayers.
Reserves and debt do not make bad infrastructure good. First ask whether it is needed and worth the cost. Then decide whether to collect the taxes early or later.
If construction costs rise faster than investment returns while money waits, the reserve loses purchasing power.
The 2022 figure is as restated in the 2023 audited statements for the asset-retirement-obligation accounting standard, so both years are on the same basis.
The annual series uses the latest published comparative for each year where a later annual report restated the earlier figure.
What should be measured next: Before building anything, show that it is needed, that the benefits are worth the cost, and that it will be purchased as efficiently as possible. Then decide whether to collect the tax early into reserves or later through debt.
Long-term debt declined
Audited long-term debt fell from $37.5 million in 2000 to $7.1 million in 2025. Debt lets the City pay for a long-lived asset over time, rather than collect all the money before building it.
2000-2025 / millions of dollars · Long-term debt ($ millions)
$7.1m2025 · Long-term debt
Sources & methods
A low debt balance alone does not show whether infrastructure is adequate or projects offer good value. Interest, construction costs and the cost of waiting all matter.
All values are the audited long-term debt line in the City's annual reports (Municipal Finance Authority debt net of actuarial adjustments; capital leases and short-term borrowing are separate lines and excluded). Each 2000-2014 value was confirmed in two consecutive annual reports where both exist.
The loans continuing at year-end carried rates from 1.47% to 3.15%, below the approximately 3.45% annualized rise in Vancouver non-residential building costs over the 20 and 30 years ending in Q2 2026. That index is a B.C. market proxy, not a Campbell River civil-infrastructure index. Project costs vary, existing loan rates do not price a new loan, and longer MFA loans can carry refinancing risk.
The 20- and 30-year construction comparisons use the Vancouver non-residential building index from Q2 2006 to Q2 2026 and Q2 1996 to Q2 2026. The index rose 96.6% and 177.3%, equal to compound annual rates of 3.44% and 3.46%.
The City's major remaining Issue 141, 145 and 147 loans carried 2.80%, 3.15% and 2.66%. From their spring 2017, 2018 and 2019 issue quarters through Q2 2026, the same construction index compounded at approximately 4.80%, 4.80% and 4.76% a year.
The comparison does not say debt is always cheaper. MFA's spring 2026 10-year issue rate was 4.07%, and a separate 20- to 30-year issue was 4.82%, both above the long-run construction-cost averages after borrowing ran much lower through most of 2015-2022.
Reserves and debt do not make bad infrastructure good. First ask whether it is needed and worth the cost. Then decide whether to collect the taxes early or later.
What should be measured next: Before borrowing, show that the asset is needed, that the benefits are worth the cost, and that it will be purchased as efficiently as possible. Then compare the interest cost with the construction cost and service risk of waiting.
The municipal share of the bill
The standardized municipal charge rose from $643 in 2001 to $1,650 in 2015 (up 157%), then to $2,560 in 2026 (up a further 55.2%).
2001-2026 / nominal dollars · Municipal tax ($)
$2,5602026 · Municipal tax
Dotted line: Council term (2022).
Sources & methods
This is the municipal portion for a standardized representative house. It excludes school, regional, hospital and other levies, parcel taxes, user fees and the Home Owner Grant.
The B.C. line is the unweighted average General Municipal charge across municipalities with a published Schedule 704 value, compiled here for 2015 through 2025. Canada has no equivalent schedule.
Year
Municipal tax
Source status
2001
$643
B.C. Schedule 704
2002
$649
B.C. Schedule 704
2003
$688
B.C. Schedule 704
2004
$729
B.C. Schedule 704
2005
$824
B.C. Schedule 704
2006
$889
B.C. Schedule 704
2007
$915
B.C. Schedule 704
2008
$964
B.C. Schedule 704
2009
$1,129
B.C. Schedule 704
2010
$1,228
B.C. Schedule 704
2011
$1,294
B.C. Schedule 704
2012
$1,474
B.C. Schedule 704
2013
$1,545
B.C. Schedule 704
2014
$1,607
B.C. Schedule 704
2015
$1,650
B.C. Schedule 704
2016
$1,733
B.C. Schedule 704
2017
$1,839
B.C. Schedule 704
2018
$1,884
B.C. Schedule 704
2019
$1,973
B.C. Schedule 704
2020
$2,031
B.C. Schedule 704
2021
$2,000
B.C. Schedule 704
2022
$2,105
B.C. Schedule 704
2023
$2,306
B.C. Schedule 704
2024
$2,404
B.C. Schedule 704
2025
$2,480
B.C. Schedule 704
2026
$2,560
B.C. Schedule 704
Method notes
The values are the General Municipal column in B.C. Schedule 704; the schedule series begins with 2001.
The October 2022 election is marked without treating all of 2022 as the work of the current Council.
The 2026 point uses the Province's final Schedule 704 value.
What should be measured next: Keep the Province's Schedule 704 definition stable and add the next published year without mixing in a different household-tax measure.
Where Campbell River's 2025 money came from and went
2025 audited City finances
The City's 2025 accounts show $98.9 million in revenue. Follow the sources of that revenue and the costs it covered.
Select any category.See the audited amount, what it means and what is included.
Where it came from
2025 recognized revenue$98.9M
Where it went
Important: the $8.6M annual surplus is an accounting result, not uncommitted cash. The expense total includes $12.7M of amortization, while revenue includes contributed infrastructure and other restricted or capital-related amounts.
Sources & methods
03 / The Record
Around town.
Roads, pipes and drainage are boring right up until one stops working. Parks and places to play matter too.
A few things Campbell River has been working on. Some are finished and in use. Others still have work ahead. Council, staff, community organizations and our partners all have a part in this.
Photos from my own collection, except where credited. Project status checked September 21, 2026.
Opened in 2024
A place for small businesses to start.
The Rail Yard Market gives small retailers a place to test an idea without taking on a full storefront. Affordable, short-term leases and a downtown location make it a practical step for a growing business.
A City project with funding from the Province and Island Coastal Economic Trust. The photo is from September 1, after the soft launch and before the September 13 official opening.
The Rail Yard Market, September 2024.
Completed in 2023
A better walk along Willis Road.
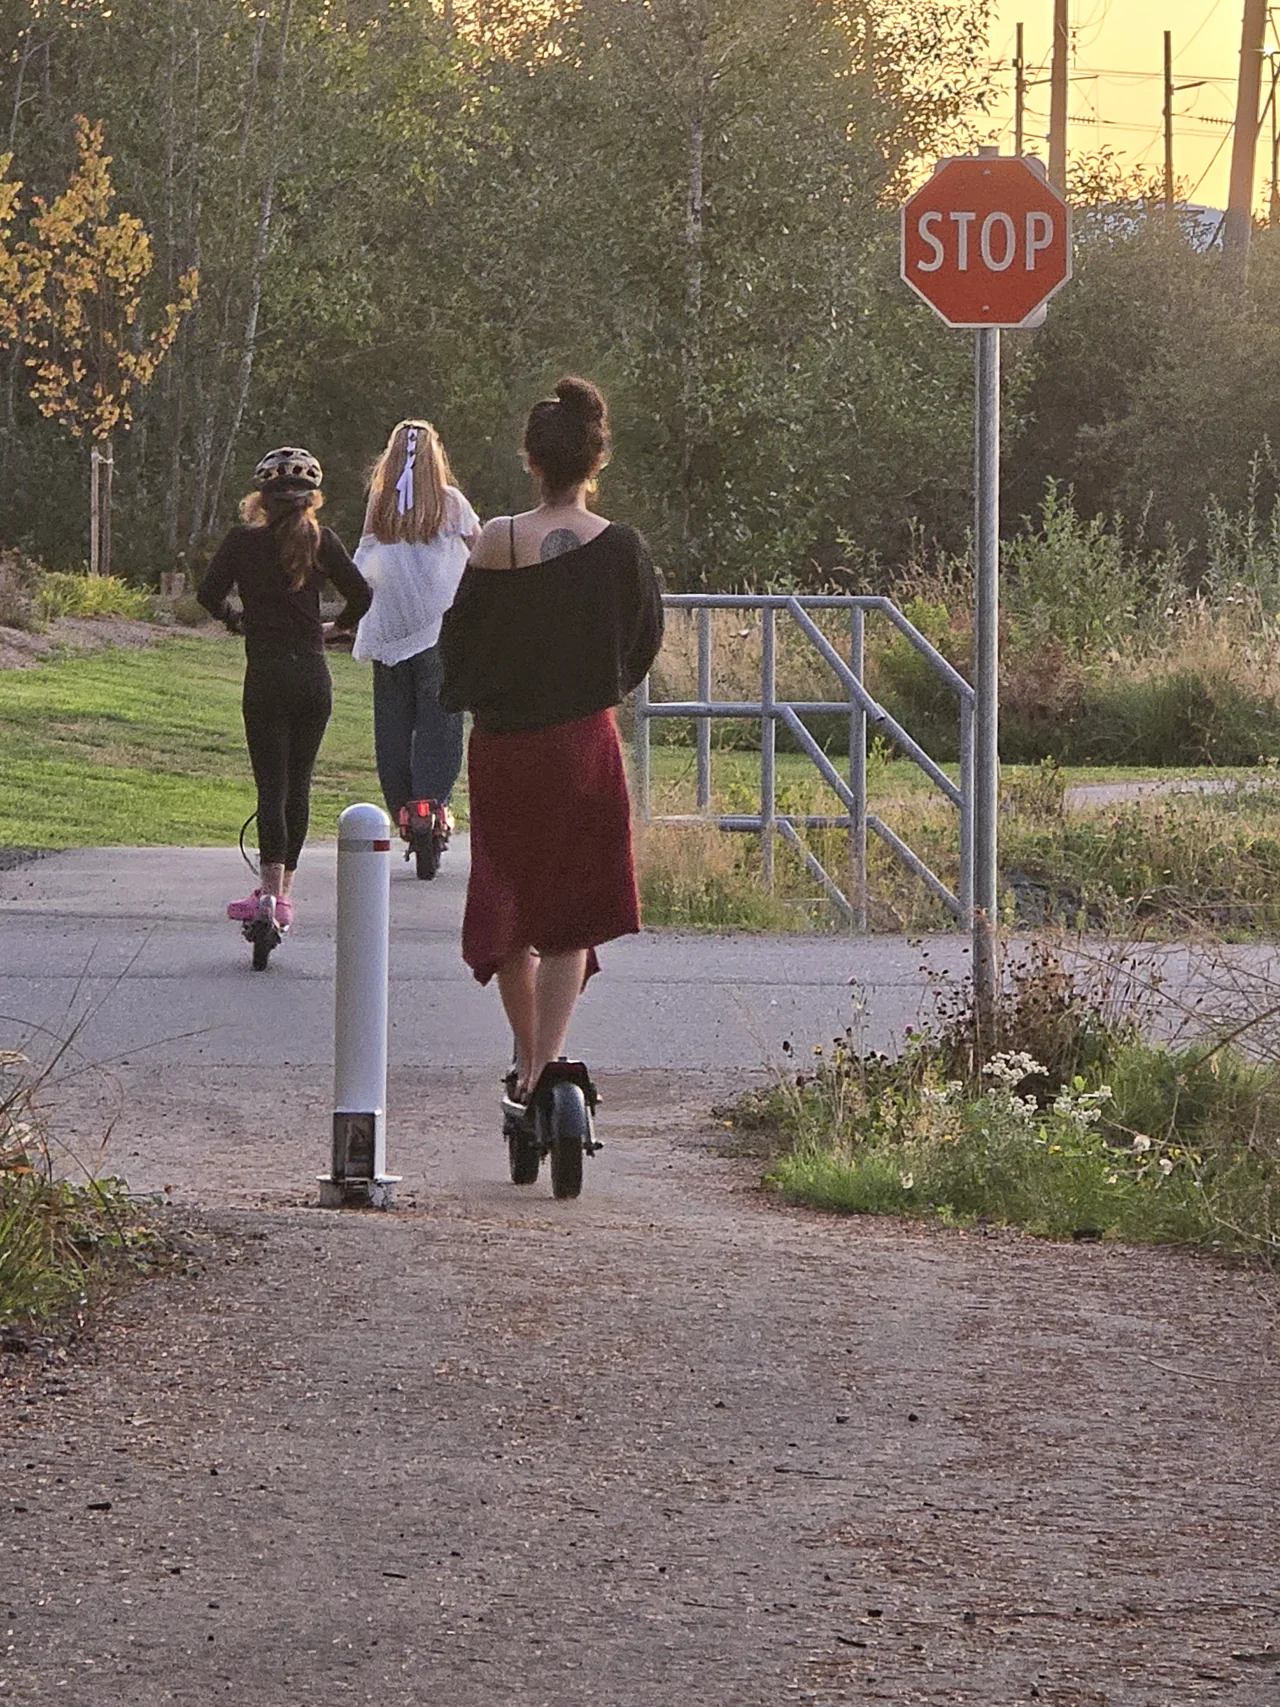
The pedestrian path from Carolyn Road to Highway 19 was completed in 2023. It is a useful everyday connection for people walking through the neighbourhood.
Planning began before this Council's term. This is work completed during the term, with a photo taken in 2025.
Willis Road path, August 2025.
Opened in 2025
Room for the dogs, too.
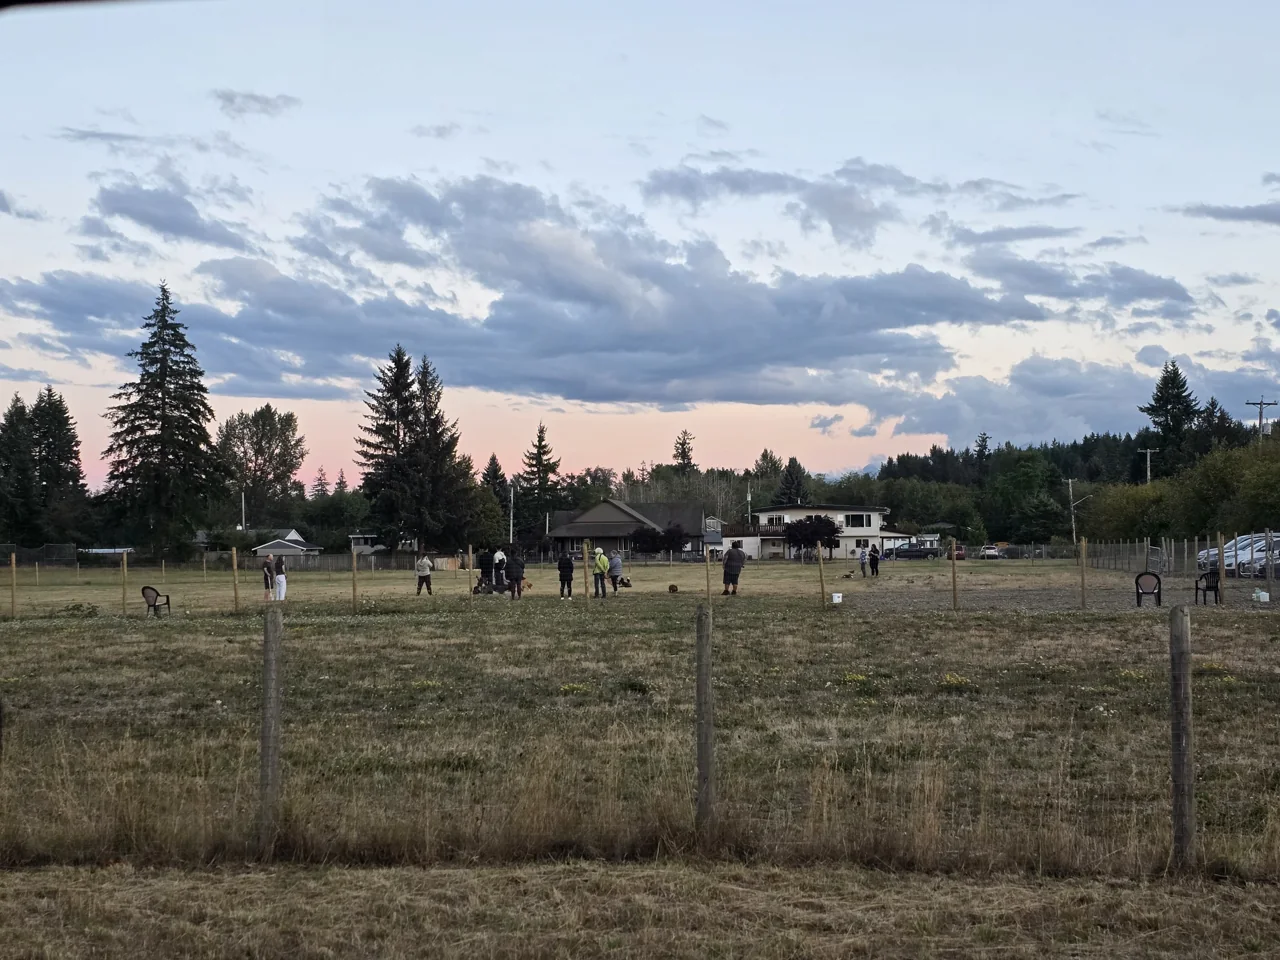
Evergreen and Robron gained designated off-leash dog parks in 2025. The City operates them on School District 72 land under a temporary agreement for up to five years. A useful partnership, and places people are already using.
The photograph shows Evergreen. These are temporary park sites, not permanent land acquisitions.
Evergreen dog park, August 2025.
Structural repairs completed in 2025
Looking after Discovery Pier.
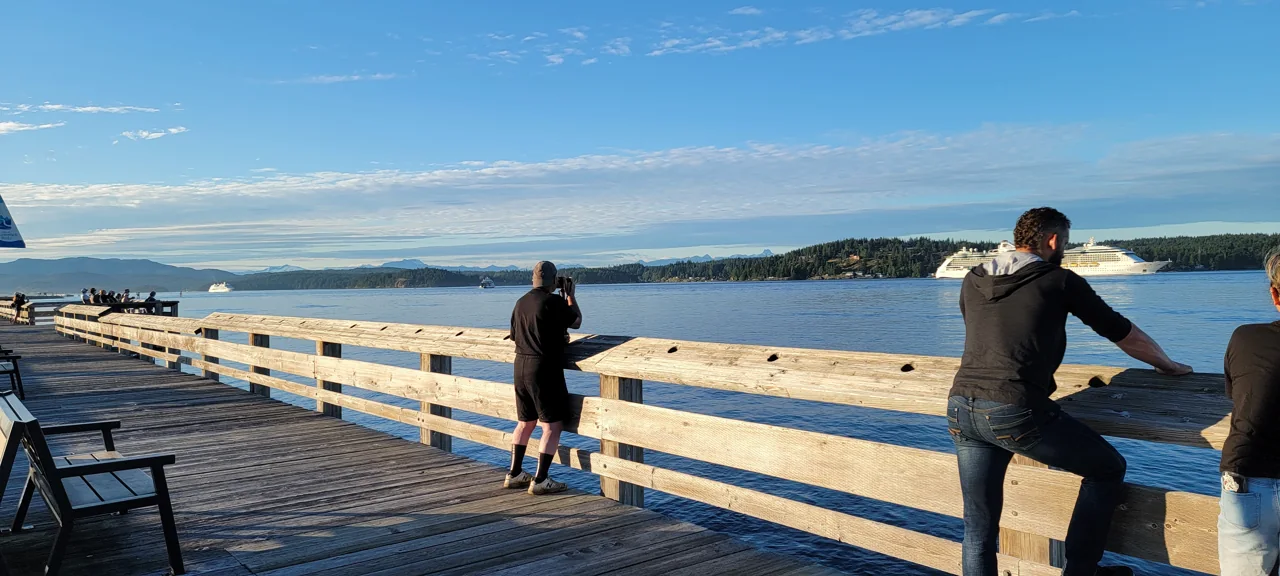
Some of the most useful work is looking after what we already have. Structural repairs to Discovery Pier were completed in 2025, renewing a place residents and visitors have enjoyed for years.
This is an archival photograph of the pier in use. It does not show the completed 2025 repairs.
Discovery Pier in June 2022, before the repairs described here.
Summer programming
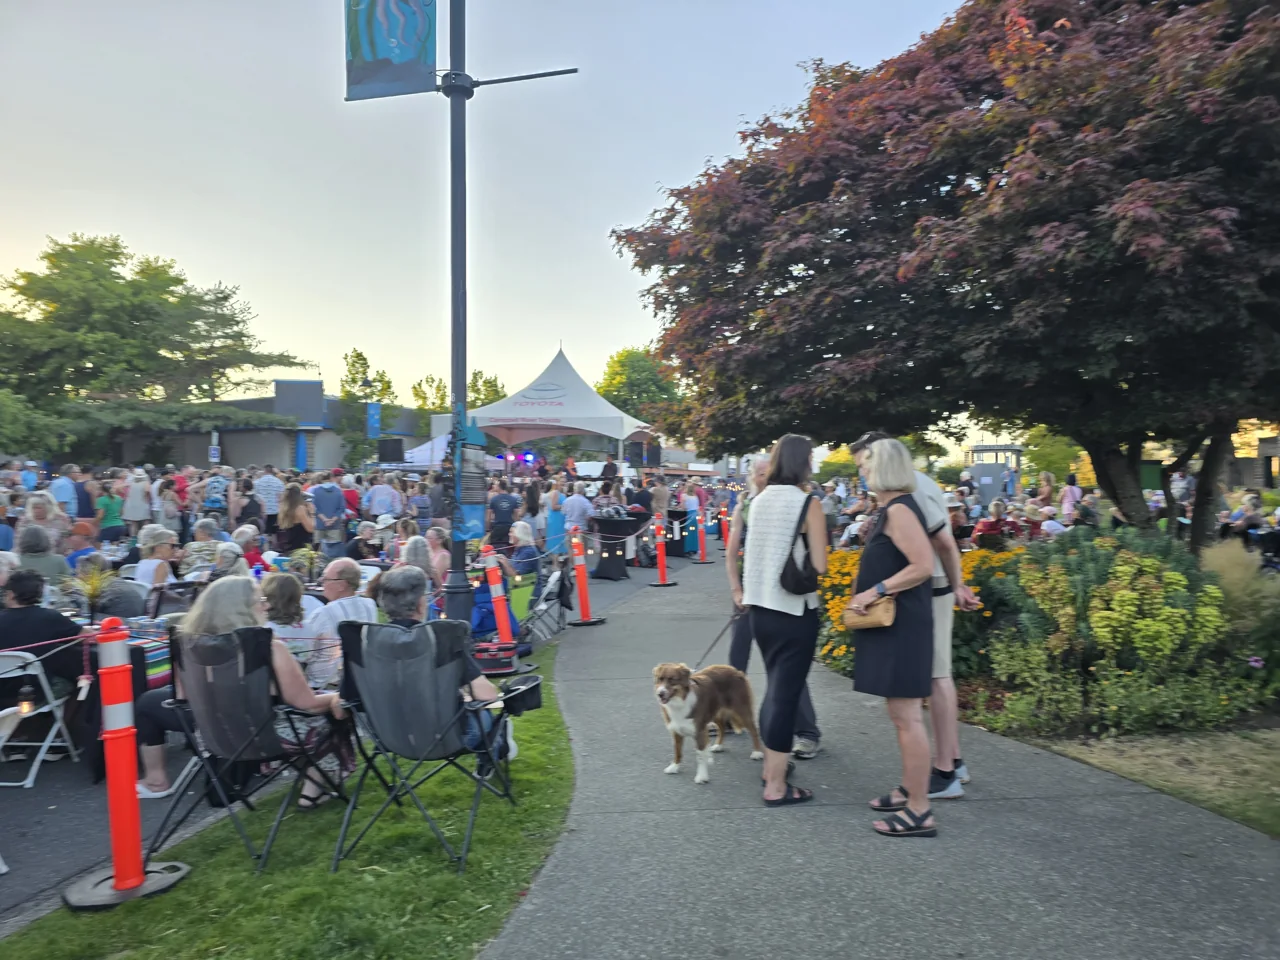
A reason to spend an evening downtown.
CR Live Streets brings free music, arts and entertainment downtown. The City, Tidemark Theatre and Highway 19 Concerts helped make the 2025 series happen. It is good to see our streets full of people enjoying themselves.
An ongoing program, not a new event invented during this term.
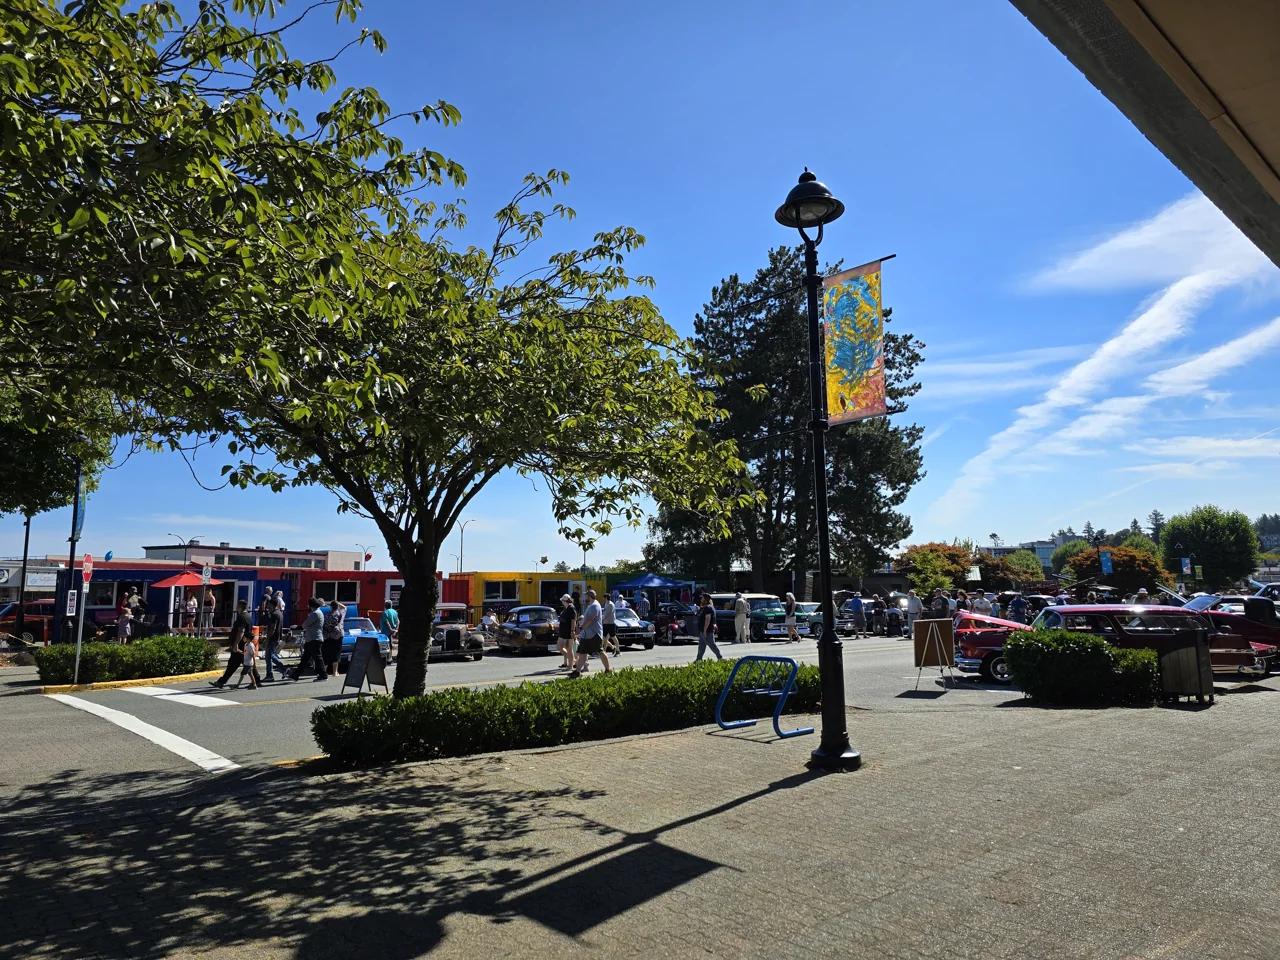
CR Live Streets, July 2025.
Seasonal service launched in May 2026
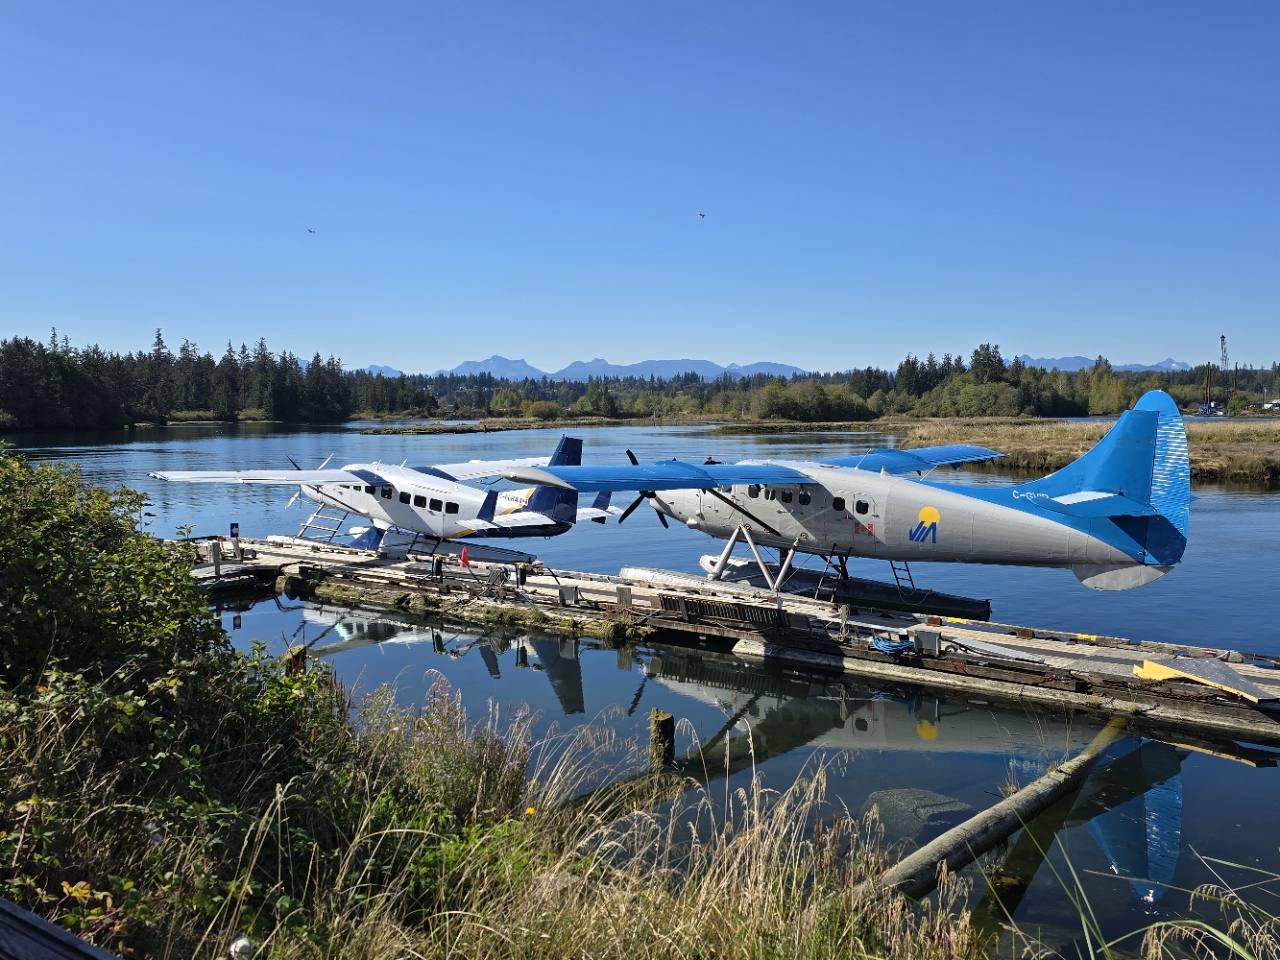
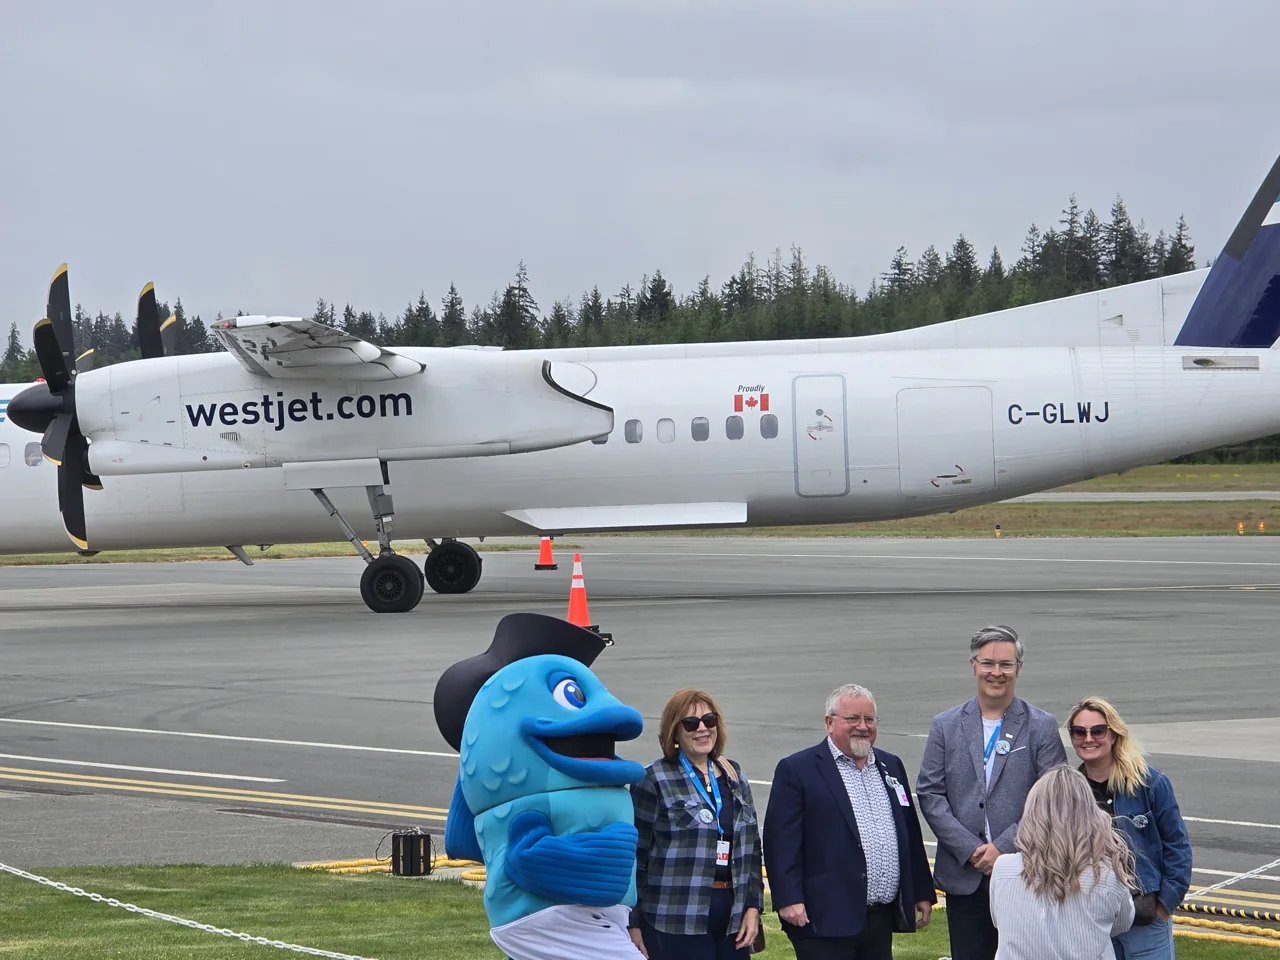
Another connection from our airport.
WestJet's seasonal Calgary service adds another way to travel from Campbell River, and another way for visitors to get here. The airport is a City asset. Reliable facilities and useful connections both matter.
WestJet operates the route. The photograph shows the May 2026 arrival, not the separate lighting and taxiway upgrades completed in 2023. This is seasonal service, not a year-round schedule.
WestJet at Campbell River Airport, May 15, 2026.
Redevelopment in progress
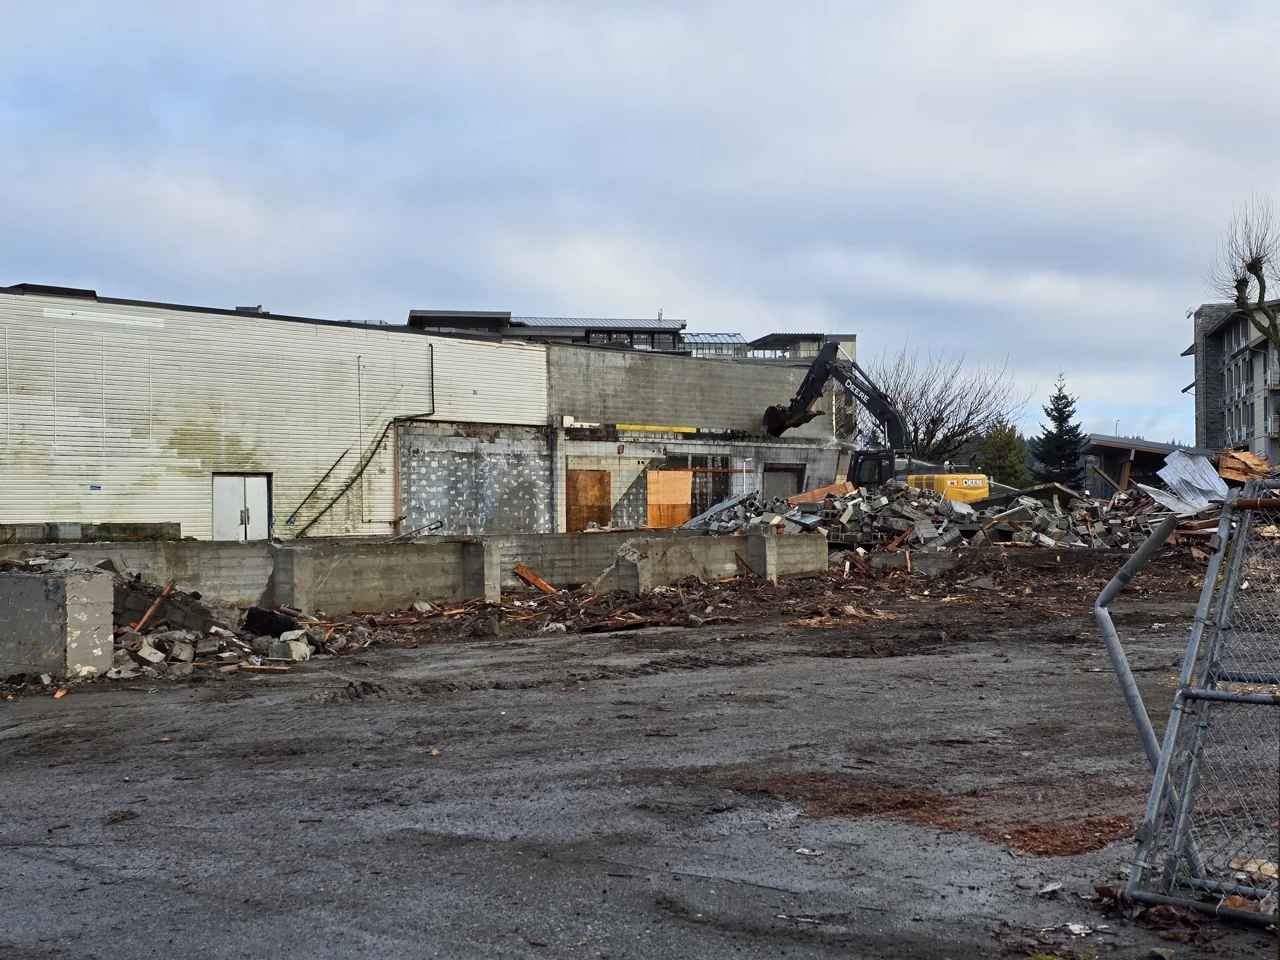
Making room on Shoppers Row.
Demolition at the former Harbourside Inn is part of Reimagine the Row. The aim is homes and commercial space in the heart of downtown. Preparing the site is a visible step; the new homes still have to be built.
The September update reports completed onsite archaeological investigation and a Site Alteration Permit application being prepared. That permit is required before construction proceeds. The project involves the City, development partners and work with First Nations and archaeological specialists.
Harbourside demolition, January 2026.
Under construction · 2026
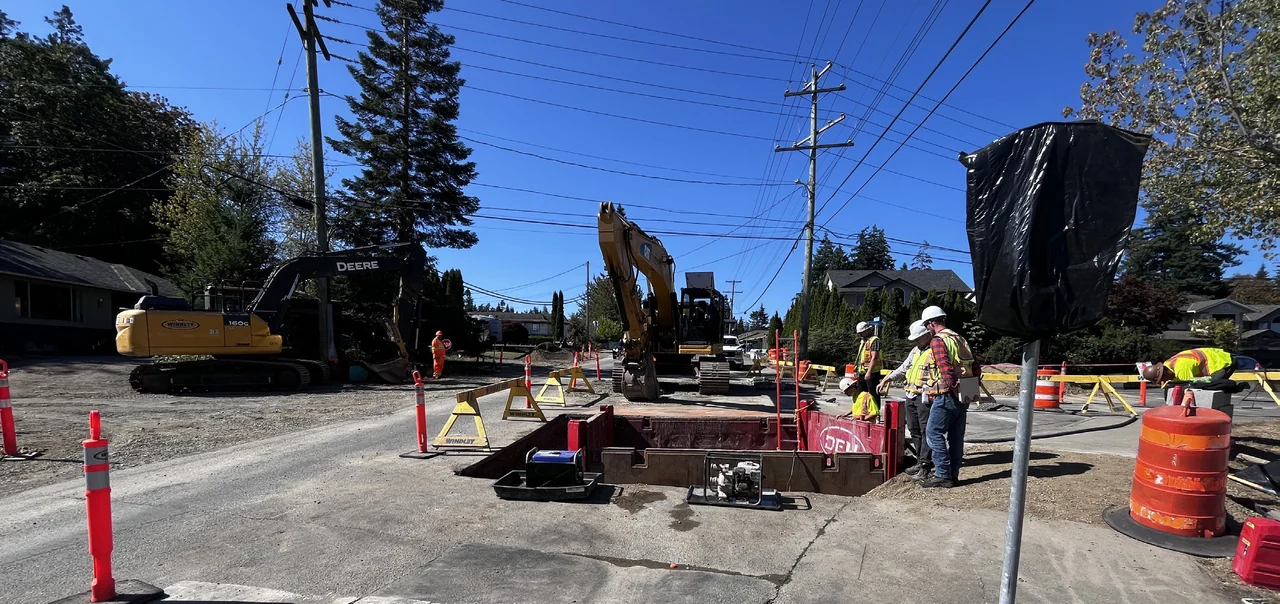
Erickson Road is finally underway.
Erickson Road has been a long time coming. Work is finally underway to replace aging water and stormwater pipes, from just west of Nature Park Drive to the Larwood Creek crossing.
The City's September update also confirms repaving between Harrogate Road and Larwood Creek, new sidewalk connections along that section's north side, and a crossing with flashing amber lights at the Willow Creek Watershed Park trailhead.
Construction is in progress. The September newsletter confirms paving and sidewalk additions within the approved budget. Further extensions are being explored, and traffic calming is not included in this phase. The photograph is reproduced from page 2 of that newsletter; its capture date is not stated.
Construction photo from the City's September 2026 update. Photo: City of Campbell River.
Under construction · Regional project
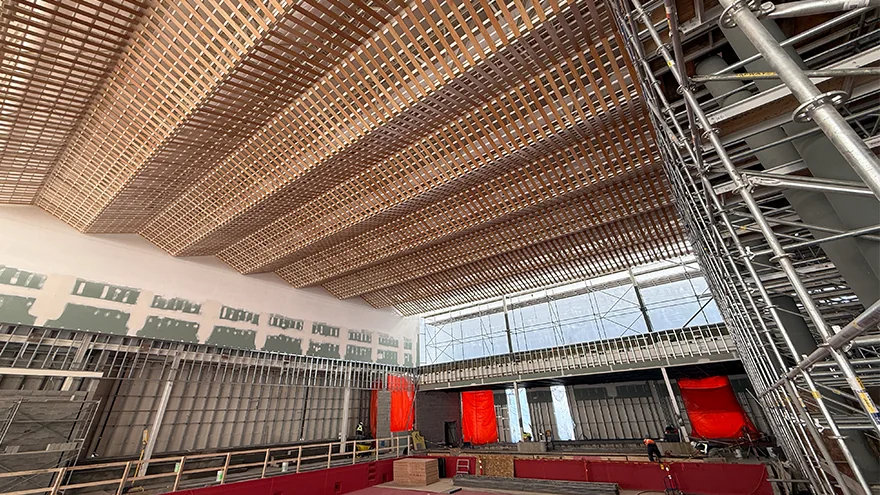
Strathcona Gardens is taking shape.
The new aquatic centre is taking shape after years of planning. The Strathcona Regional District has announced October 16, 2026 for the first public access. The remaining wellness and other Phase 1 work is expected in summer 2027.
Owned and operated by the SRD, serving Campbell River and Area D. The first pool sessions require pre-registration. This construction photograph is from the SRD's May 2026 update; it is not a rendering or a photo of the finished pool.
Aquatic centre construction, May 2026. Photo: Strathcona Regional District.
Nunns Creek, during construction.
Work in progress · 2026
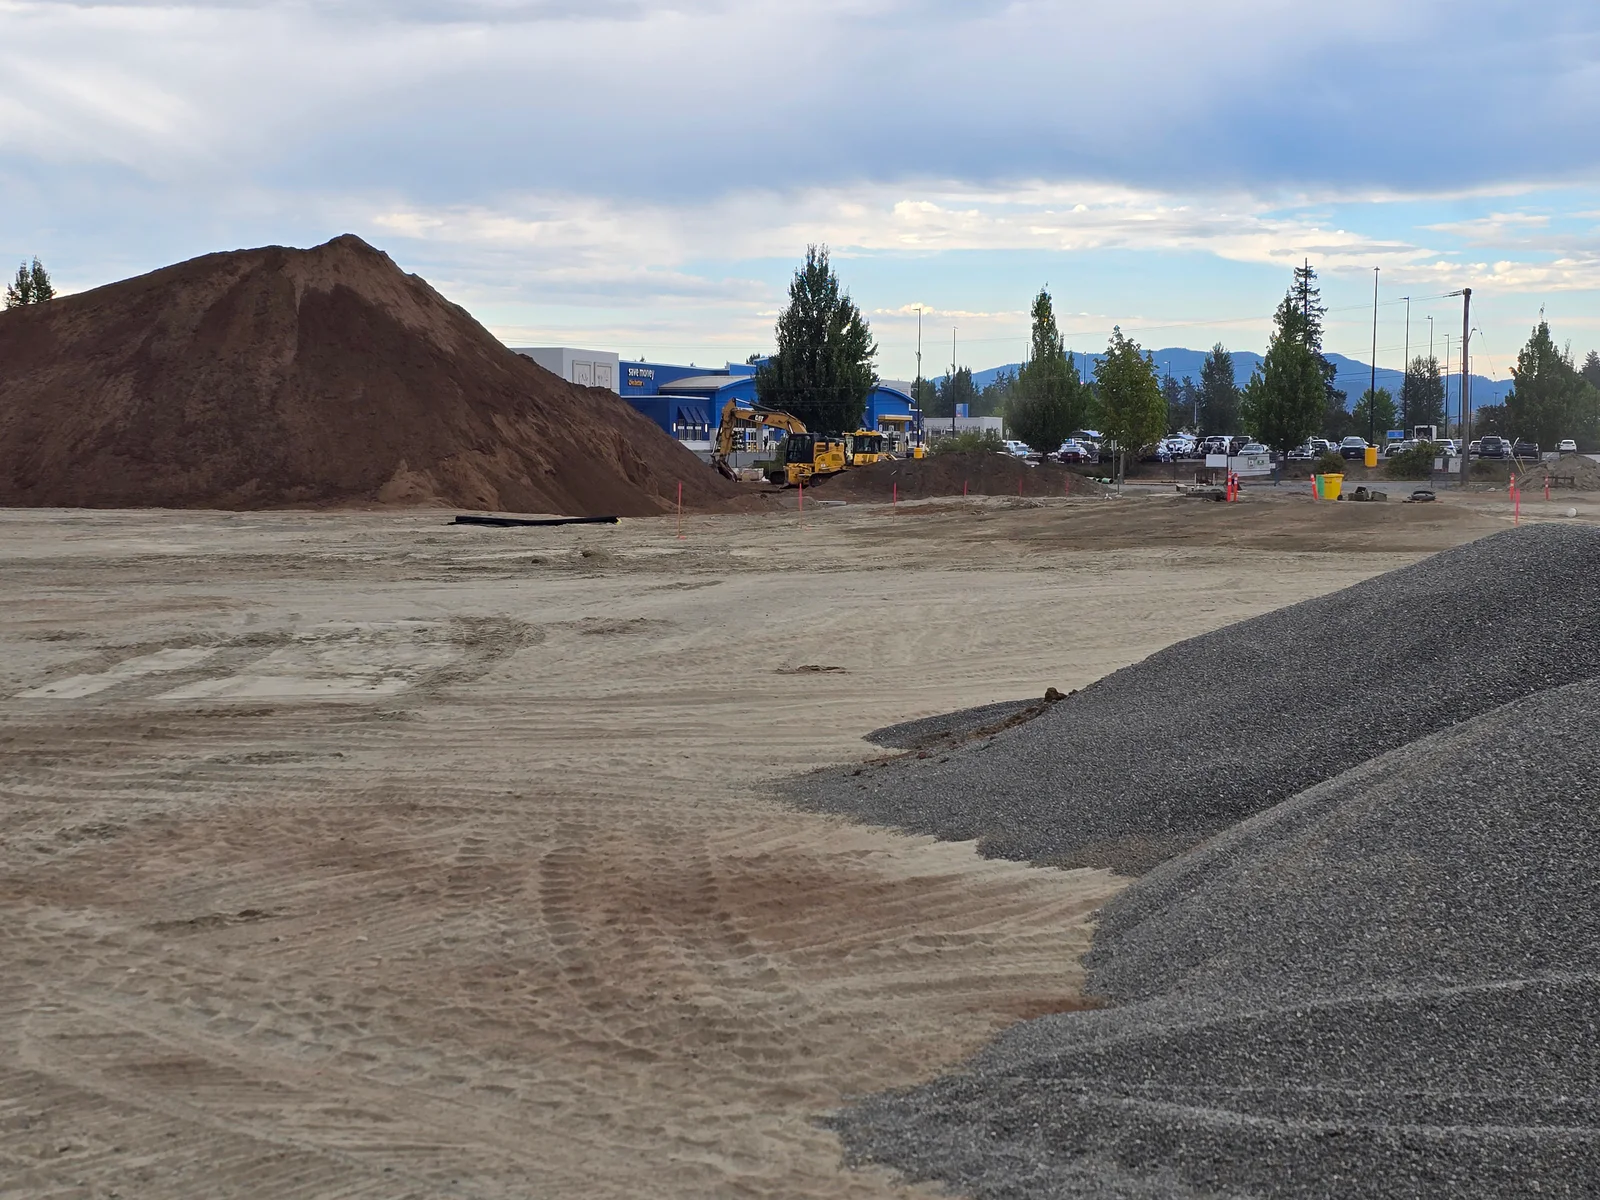
Nunns Creek is becoming a dedicated slo-pitch hub.
Four tournament-capable fields, including two multi-use fields, better drainage and improved accessibility. That is what the construction is for.
The City's July notice set a goal of play in spring 2027. It is work in progress, not a finished amenity.
This 2026 work is separate from the 2023 to 2025 audited acquisitions shown below.
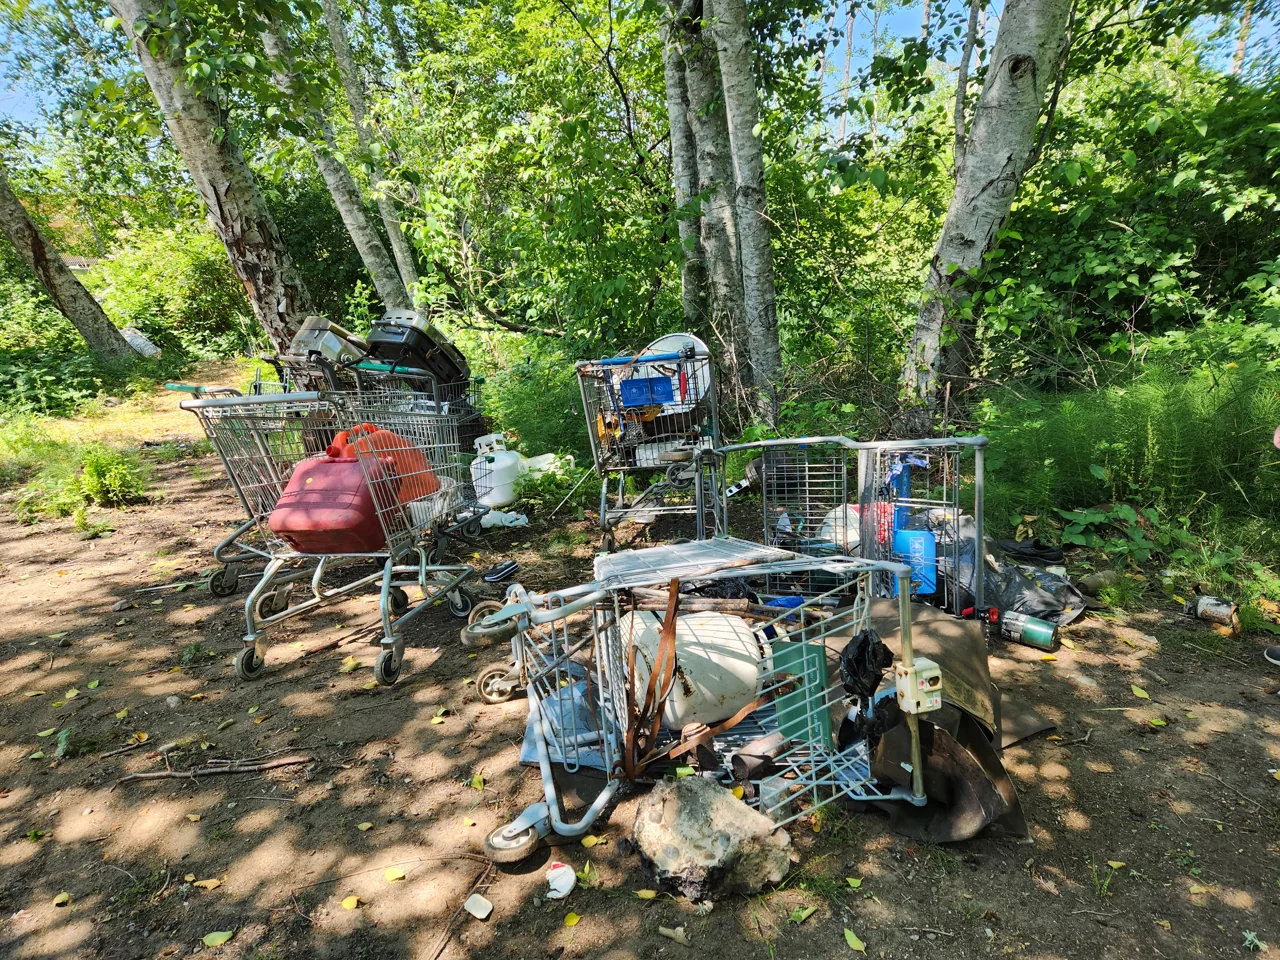
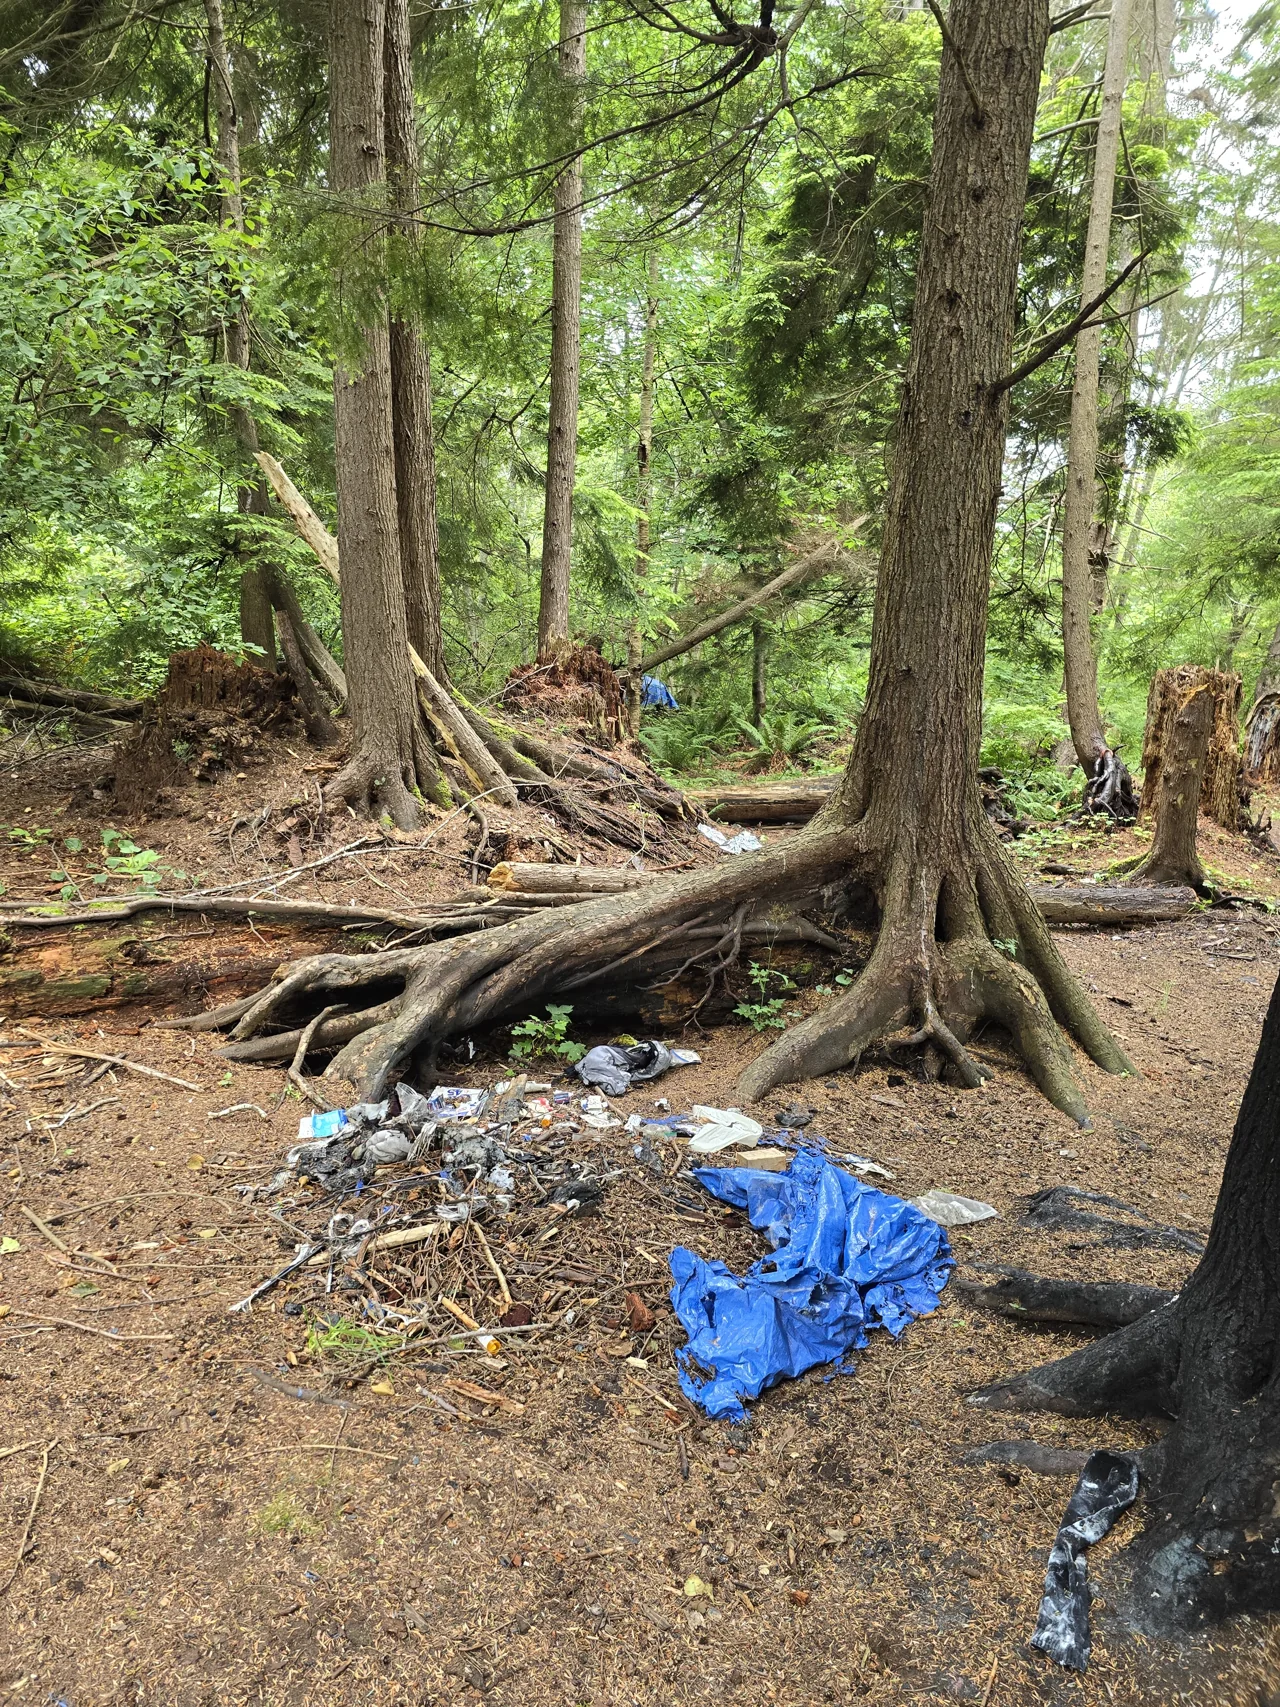
Earlier Nunns Creek photos · 2023 and 2024
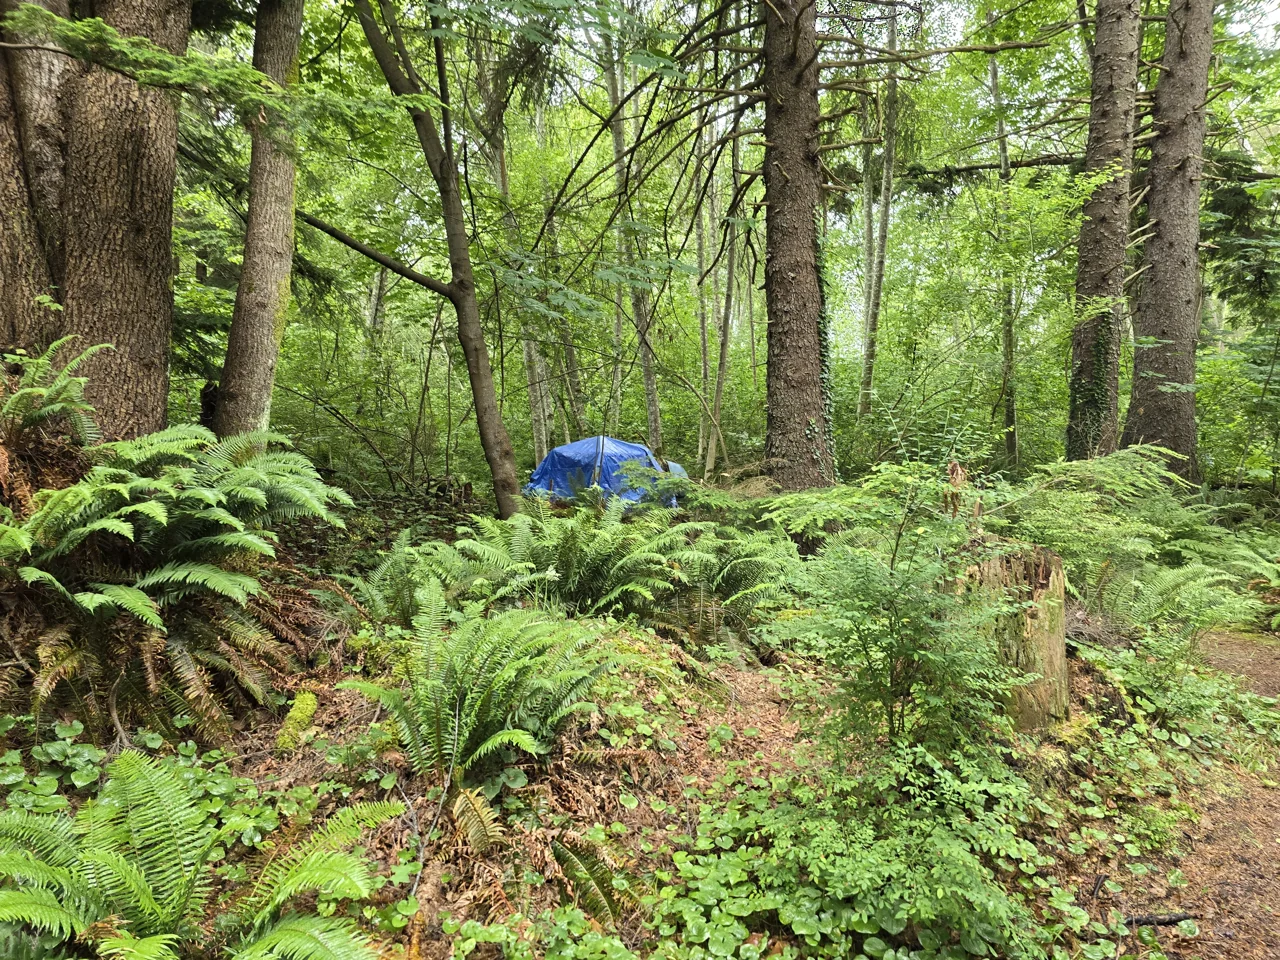
These photographs record encampment debris in the park's wooded areas. They show why cleanup and continued care matter. They are separate from the ballfield construction shown above.
June 24, 2023.June 29, 2024.June 29, 2024.
There is a financial record behind this work, too. The chart covers City capital acquisitions across all projects, not just the places photographed here.
Investment in city infrastructure
Audited City-funded capital acquisitions totalled $53.9 million from 2023 through 2025. The separate Q4 2025 project report listed 63 of 115 capital projects as complete or substantially complete and in service.
2000-2025 / millions of dollars / three reporting bases · Capital investment ($ millions)
$14.6m2025 · Capital investment
Dotted line: Council term (2022).
Audited City capital acquisitions. Spending is not a count of completed projects; regional projects are separate.
Sources & methods
The Q4 status report does not provide a consistent promised-versus-actual completion date or one comparable on-budget rate for every project. From 2010 onward the acquisition series also excludes assets contributed by developers and other parties.
Accounting rules changed twice across this series. 2010 onward: audited City-funded tangible-capital-asset acquisitions from the annual reports (click a bar for the project list). 2008-2009: total TCA acquisitions the City reported to the provincial ministry during the accounting transition. 2000-2007: consolidated capital-fund expenditures from ministry Schedule 402, the pre-2009 accounting basis. The older bars describe the same activity on different accounting rules, so exact year-to-year comparisons across the breaks are not valid.
The Q4 2025 project-status snapshot covered 115 capital projects: 63 complete or substantially complete and in service, 23 in progress, 27 delayed and 2 cancelled. Three projects exceeded budget by more than $10,000, by $41,979 combined.
What should be measured next: Keep the quarterly status list and add a consistent annual scorecard for projects completed on time, completed on budget, delayed, changed in scope and cancelled.
What happened to the 2025 capital plan?Expanded
The completed work and the unfinished work.
The year-end report tracked 115 capital projects: 63 were complete or mostly complete and in service, 23 were in progress, 27 were delayed and 2 were cancelled.
A city needs more than pipes and police. Support should be visible and tied to public value.
What we contribute to local organizations.
Local organizations run the places and programs that make a city worth living in. The City's 2024 policy review found Campbell River above its peer benchmarks for grants, municipal tax exemptions, and arts and culture funding.
2024 policy review · Historical comparison
Annual totals: Campbell River 2024, peer benchmarks from 2023. Shared scale: $0 to $1 million.
Grants
+33%
Adjusted peer average$702K
Campbell River$931K
Municipal tax exemptions
+19%
Adjusted peer average$603K
Campbell River≈ $720K
Core arts and culture funding
+64%
Reported peer average$403K
Campbell River$660K
Arts funding is included in grants. Do not add the three categories together.
Peer group: Courtenay, Langford, Langley (City), Mission, North Cowichan, Penticton, Port Moody, Vernon, West Kelowna. Benchmarks summarize the group; they are not individual community amounts.
Sources & methods
Grants and exemptions use inflation-adjusted peer averages; arts uses the report's separate average. These are annual totals, not per-resident figures.
Peer methods differ by category. Leases and facilities are excluded. This is not a peer comparison of the full $2.87 million support package.
Source: City financial-assistance policy review, November 2024, pp. 1, 3, 5 and 54 to 58
The amounts behind the comparison
Same categories. Clear limits.
2024 policy review. Annual dollars, not per resident.
Support
Campbell River
Peer benchmark
CR above benchmark
Grants
$931,100
$701,659
33%
Municipal tax exemptions
About $720,000
$603,464
About 19%
Grants + municipal tax exemptions
About $1,651,100
$1,305,123
About 27%
Core arts and culture funding
$660,000
$402,669
64%
How the peer benchmarks were calculated
The nine comparator communities: Courtenay, Langford, Langley (City), Mission, North Cowichan, Penticton, Port Moody, Vernon, West Kelowna.
This is the comparison used in the November 2024 policy review, not a claim about today's funding. Campbell River's 2024 amounts are compared with the City's inflation-adjusted benchmarks drawn from 2023 peer reports.
For grants and municipal exemptions, staff excluded the highest and lowest of nine comparator communities before adjusting the remaining average for inflation. Different communities were excluded in each category. These are adjusted peer benchmarks, not the unadjusted average of all nine communities.
The grant benchmark includes comparable funding within municipal base budgets as well as grants. It is broader than the SOFI grant-payment series shown in the grant-history card.
The approximately $720,000 Campbell River tax-exemption figure comes from the report's executive summary. The separate full-package financial summary uses $668,000. They are different snapshots and are not combined here.
All amounts are annual totals, not per-resident amounts. Programs and regional funding arrangements differ. Staff noted that some peers near larger cities benefit from services provided in neighbouring communities.
The combined row adds the grants and exemptions above, including their separately adjusted benchmarks. It is a derived comparison, not a separately reported peer average.
Arts funding is part of grants, not extra support to add to the other rows. The $660,000 is the six local payments listed below from pages 57 and 58. The $402,669 is the separate reported average on page 56, which accounts for regional delivery of Vernon-area arts services. It does not use the same trimming and inflation adjustment as the first two categories.
Percentages use (Campbell River amount / peer benchmark - 1) × 100, rounded to whole percentages. All three chart categories share a zero-to-$1 million scale. The table gives exact values, including the combined grants and exemptions calculation.
No comparable all-in peer totals were available for below-market leases and facilities. These benchmarks cannot be compared directly with the separate $2.87 million adopted support framework. Higher support alone does not establish better services or value.
Campbell River arts and culture payments
Campbell River Museum
$246,500
Haig-Brown House
$51,000
Public Art Gallery
$80,000
Community Arts Council
$35,000
Maritime Heritage Centre
$40,000
Tidemark Theatre
$207,500
These six payments total $660,000. Lease, maintenance and tax-exemption values are excluded.
Grant history and the full support packageExpanded
Grant support held near $800,000
Council approved $798,639 in grants for 2026, a transition year. That is above the new $700,000 annual policy ceiling because existing operating grants continued for one year.
2019-2026 / dollars · Non-profit grants ($)
$798,6392026 · Non-profit grants
Sources & methods
The reports count grants differently: earlier years show approved community grants, 2024 and 2025 show payments, and 2026 includes approved community and operating grants. The trend is useful context, not a comparison of identical programs.
What should be measured next: Use the same categories each year and say what the grants achieved, so residents do not have to take the reports apart to compare them.
The full non-profit support package
The adopted framework values leases, grants, exemptions and facility subsidies at about $2.87 million, down 9.2% from its 2024 baseline. Its $700,000 grant allowance is the policy ceiling, not the higher transition-year approvals shown above.
2024 baseline and 2026 adopted / millions of dollars · Annual support ($ millions)
2024 baseline
$3.16M
Below-market leases
$1,552,000
Grants
$931,000
Tax exemptions
$668,000
Facility subsidies
$11,000
2026 adopted
$2.87M
Below-market leases
$1,552,000
Grants
$700,000
Tax exemptions
$603,000
Facility subsidies
$15,000
Both totals use the same $0 to $3.4M scale. The 2026 column is the adopted framework, not actual spending.
Includes cash and estimated non-cash support. Categories overlap with the historical comparison above; do not add them together.
Sources & methods
This combines cash grants with benefits such as reduced rent and tax exemptions. The lease value comes from a September 2024 appraisal, not an annual cheque. It is a policy comparison, not a total of 2026 spending.
What should be measured next: Separate cash from non-cash help, say what the public received and update the property values on a regular schedule.
05 / The Record
How I approach governance
Listen a lot. Think even more. Then act.
Campbell River Mayor and Council, 2022 to 2026.
Start with the facts, test the assumptions and consider who benefits and who pays. Bylaws should be clear, justified by the problem and possible to administer.
Stable staff and working relationships matter. Staff turnover is one signal of the organization's condition, not proof of what caused it.
Staff turnover fell
Turnover fell from 11.2% in 2022 to 5.2% in 2025, the lowest rate since 2016 and the second-lowest published rate in the series.
Permanent City staff turnover. This trend alone cannot establish Council's effect on retention.
Sources & methods
The council bands show who was in office, not who caused the result. Labour markets, retirements, management, restructuring and workplace conditions can all move turnover.
Comparable annual turnover rates were not found in the City's public reports before 2012. Earlier years remain blank, not zero.
Before 2014, B.C. municipal terms were three years. Election years are assigned to the council in office for most of that calendar year.
The October 2022 election is marked without treating all of 2022 as the work of the current Council.
The City later restated the 2014 and 2015 figures to 7% and 6% respectively.
What should be measured next: Keep publishing turnover, vacancies and employee feedback together, then watch whether lower churn produces faster and more predictable delivery.
There is work to carry forward.
I want the next four years to turn better numbers into a better daily experience: a downtown people feel comfortable using, homes people can move into, and services worth what we pay.
If you think this Council is moving Campbell River in the right direction, please make time to vote. A strong mandate is very important to me.